Building a Strategic Design Practice from Scratch
OPEXUS hired me to start their design function. I was employee one. Over three years, I built the design system, set up analytics to track product usage, and established research practices. The work helped convince Thoma Bravo to acquire the company at seven times its purchase price and prevented ten million dollars in customer losses during a government reorganization. Design got a seat at the board table.
The Challenge: A Company Without Design
OPEXUS was a small government software company that had just been acquired by Gemspring Capital. The new CEO, Howard Langsam, came from Granicus with a belief that design could differentiate a company in the government market. But OPEXUS had no design practice, no design system, no user research—just developers building features based on whoever spoke loudest in meetings.
The company made software for FOIA (Freedom of Information Act) compliance. More than seventy government agencies used our products to process public records requests, serving over eight thousand users daily. Nobody had ever asked those users what they needed or how they worked.
My mandate: Build a design function that could prove its value and establish design as a strategic peer to product and engineering.
The opportunity was clear: everything was broken, which meant everything could be fixed, and as the first designer the company had ever hired, I had to build from zero.
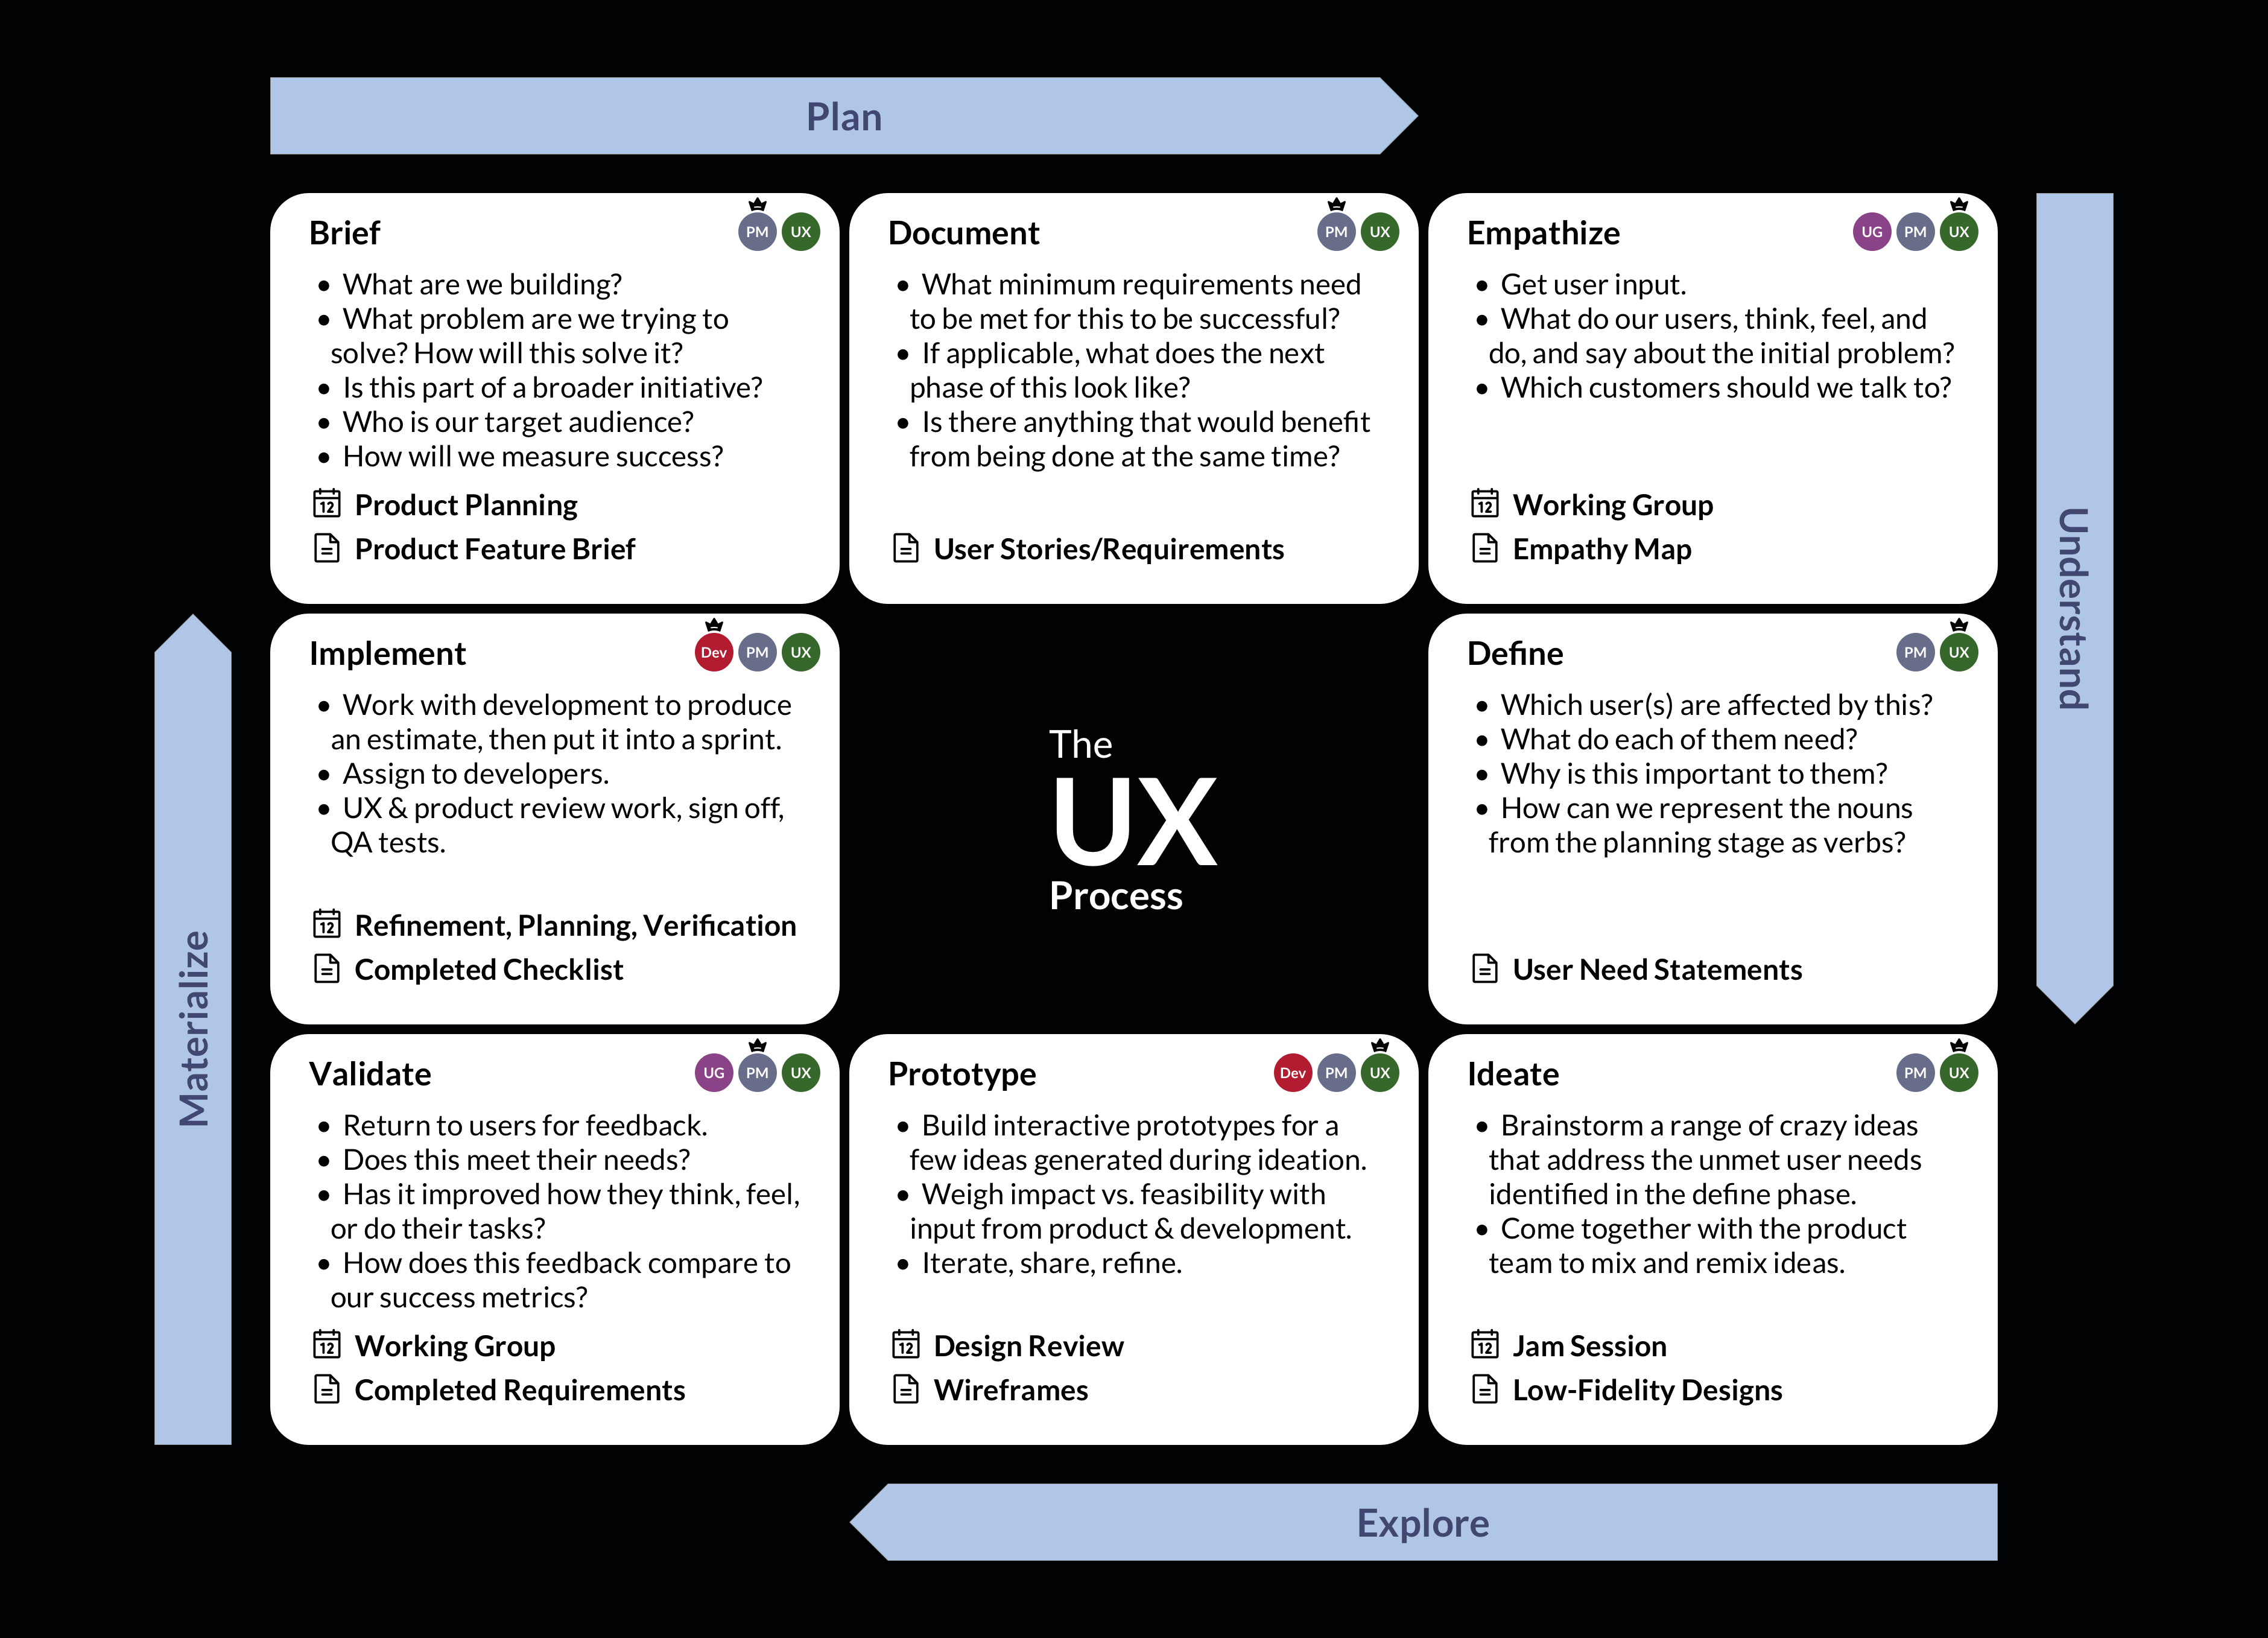
Building the Design System and Component Library
I started with a design system, which seemed like the fastest way to create measurable value.
The Problem with No System
Ten products, all built independently — buttons looked different depending on which developer coded them, forms had inconsistent validation rules, navigation worked three different ways, and every new feature required rebuilding components from scratch. The inefficiency was expensive and the user experience was incoherent.
Building the OPEXUS Design System
I built the design system in Figma over six weeks: foundation tokens for color, typography, spacing, and elevation; components for buttons, forms, tables, navigation, modals, alerts, and cards; and patterns for form validation, error handling, empty states, and loading states. Everything was documented for 508/WCAG 2.1 AA compliance with developer handoff specs, code snippets, and usage guidelines.
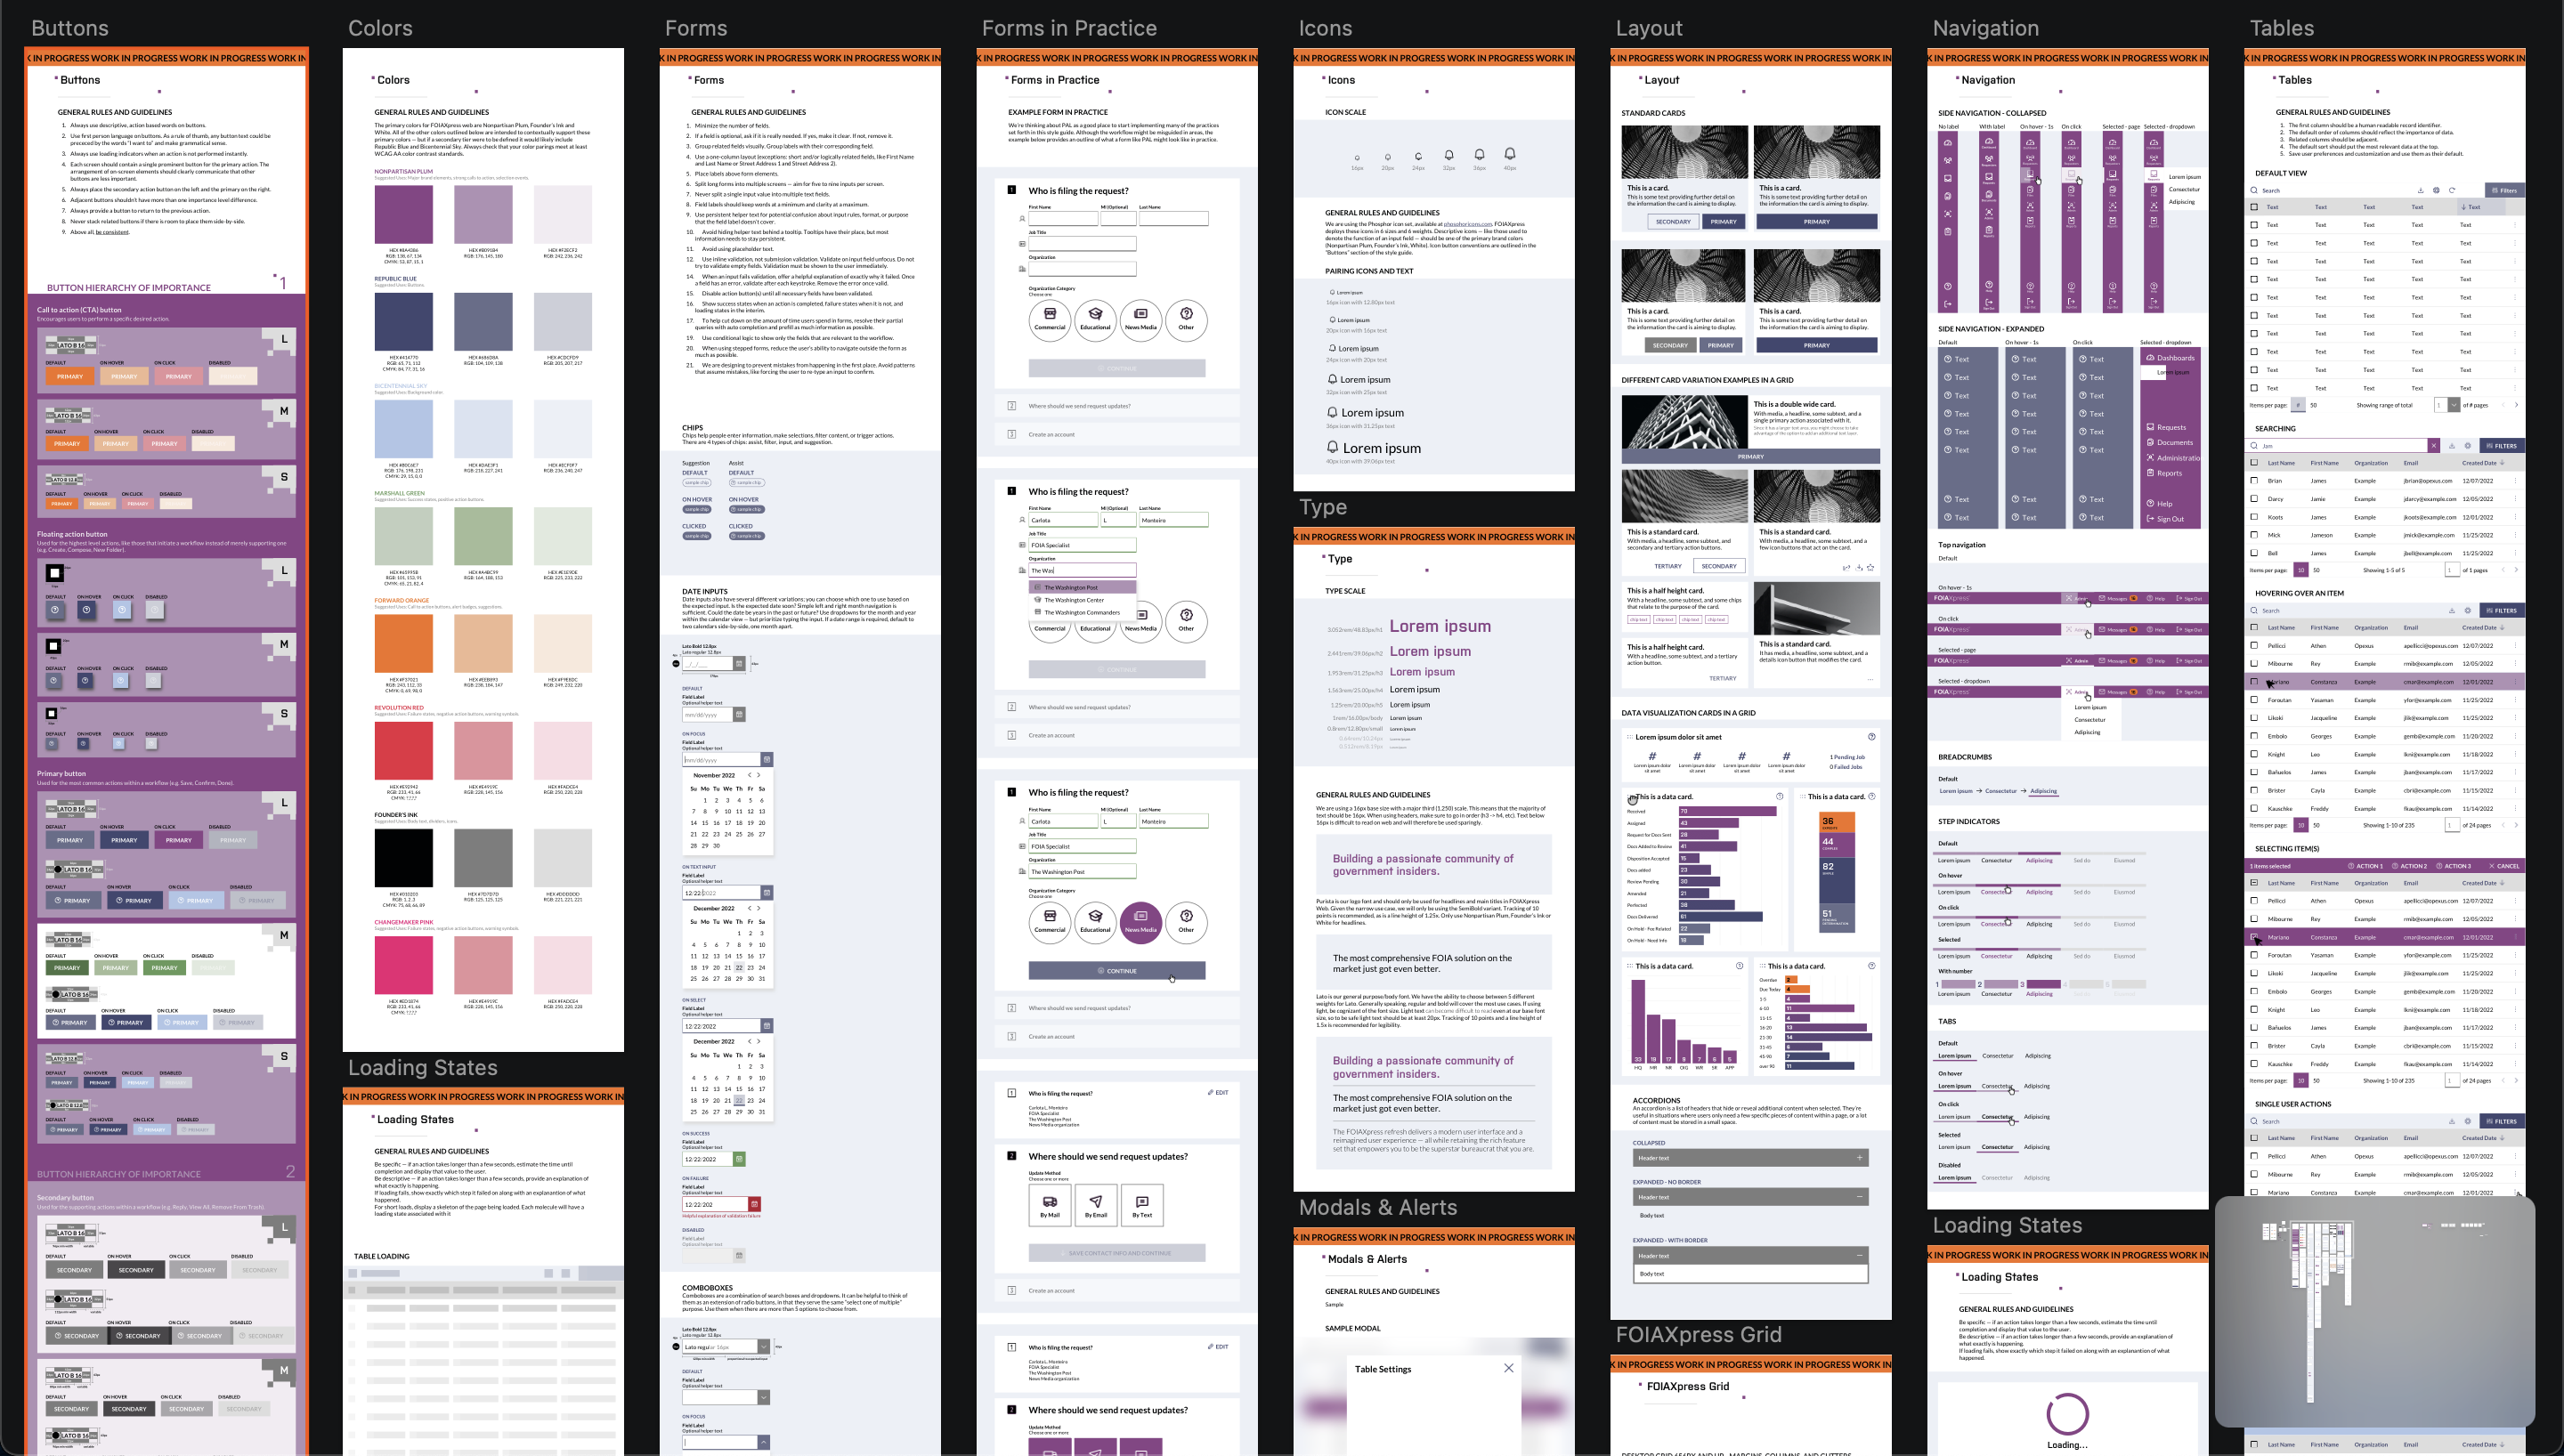
Design system component library: Standardized buttons, forms, tables, navigation, and patterns
I met weekly with the engineering team lead to review new components and solve implementation problems before they became problems, learning what was technically feasible while they learned what users needed—the system worked because we built it together.
Transformation Across Products
The design system's impact became visible immediately when we applied it across our product suite:
Before: Inconsistent spacing, 47 button variations, unclear hierarchy
After: Consistent system, clear visual hierarchy, accessible components
Before: Dense layout, hard to scan, inconsistent form elements
After: Improved readability, consistent inputs, better information architecture
Before: Cluttered interface, inconsistent patterns
After: Clean, organized, system-wide consistency
I catalogued every UI pattern across all ten products—47 different button styles, 23 variations of form validation, 15 inconsistent table implementations—and documented them all.
I worked with engineering to understand which patterns were technically feasible and with product to understand which patterns users expected, then we chose the best implementations and documented our reasoning.
I built every component in Figma with variants for all states (default, hover, active, disabled, error) and documented usage guidelines, accessibility requirements, and implementation notes for developers.
I established a review process for new components where anyone could propose changes, but they had to go through design review before being added to the system.
Impact
Development time dropped by 40%, the UI became consistent across all products, developers could build new features without waiting for design specs, and customers noticed the difference — we started getting compliments on the interface, which had never happened before.
I presented the results to the Executive Leadership Team with before-and-after timelines, efficiency metrics, and customer feedback. This became my template: build something, measure it, prove its value, ask for more resources. It worked, and I moved further upstream.
Measurable impact: 40% faster development, 95% UI consistency
Research: Discovering the Real Bottleneck
With tactical design work covered by the system, I started the company's first customer research practice, which meant talking to the people using our software — something that had never happened.
The FOIA Workflow
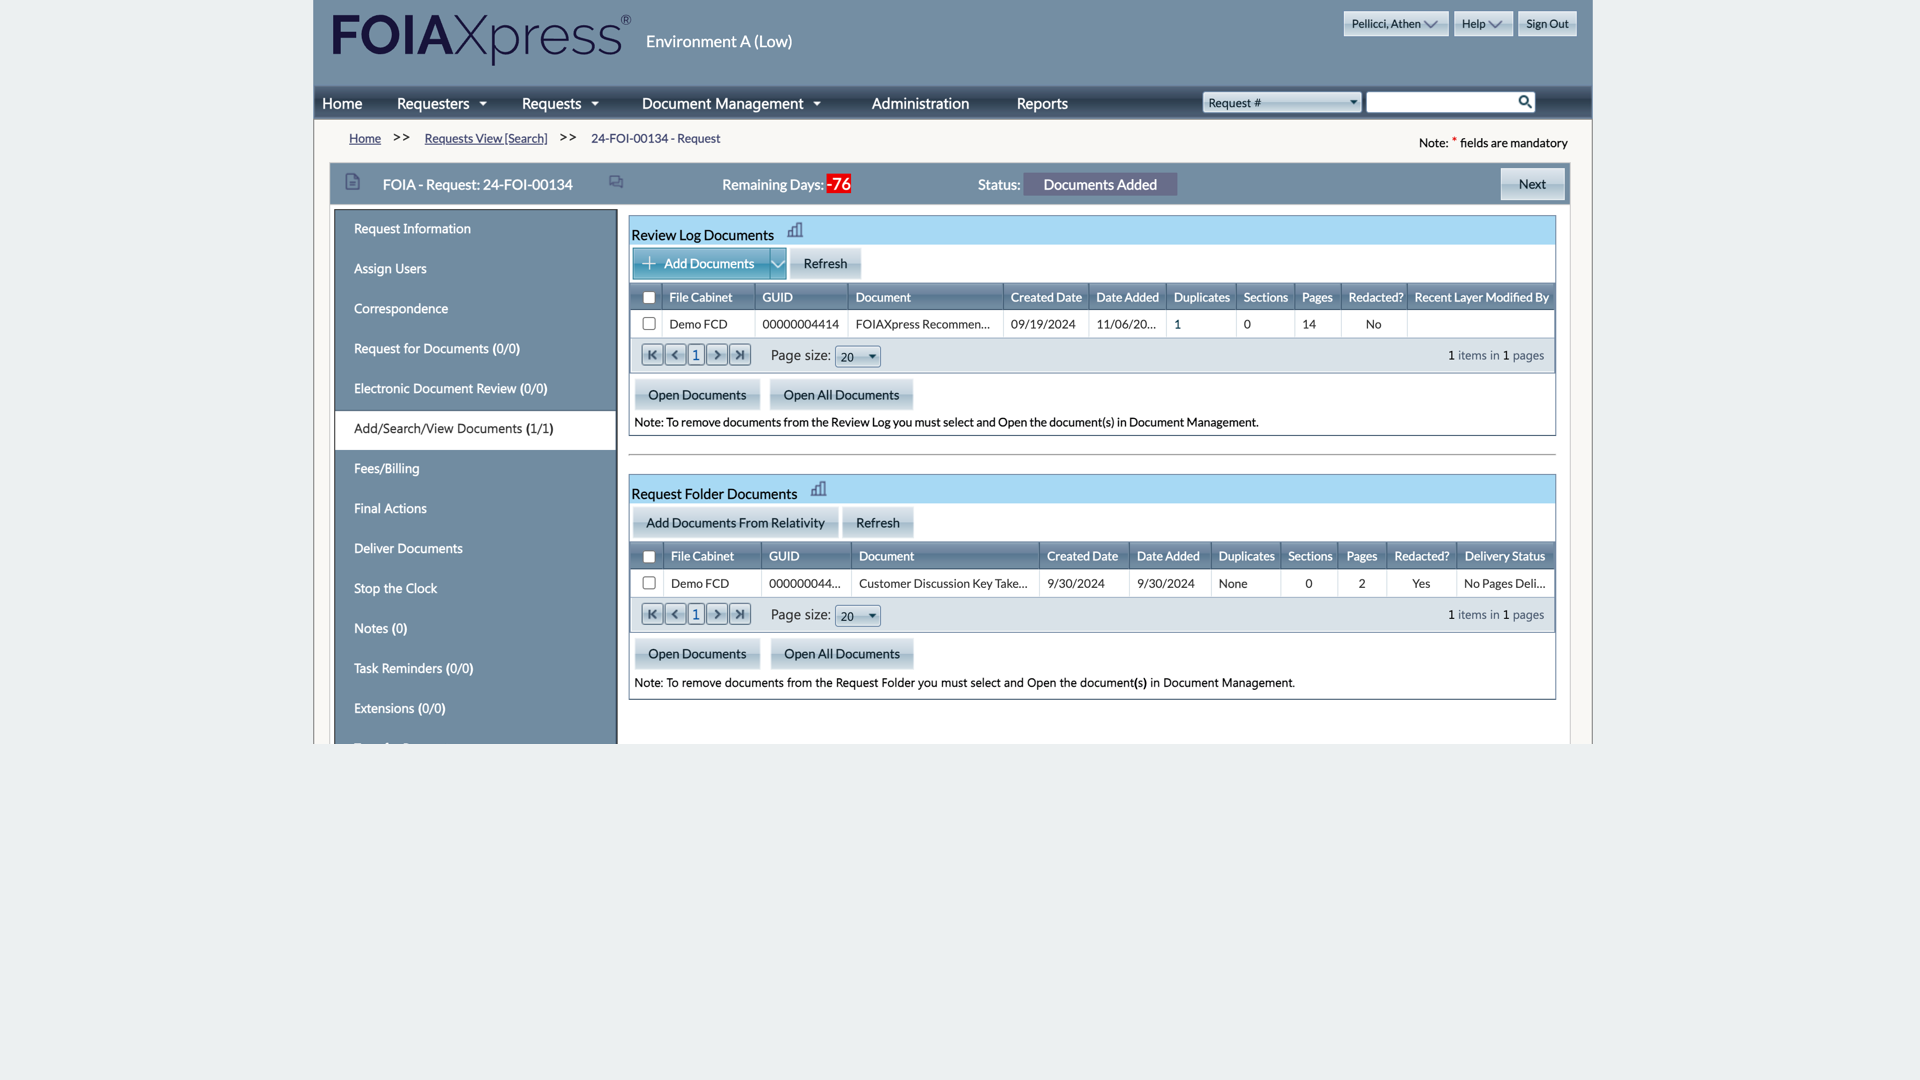
I visited agencies and sat with FOIA officers, watching them work through the process of intake, finding documents, reviewing documents, approval, and release. I learned where the system broke down and what made their jobs difficult, talking to different people several times a week across more than seventy agencies, hundreds of conversations in total.
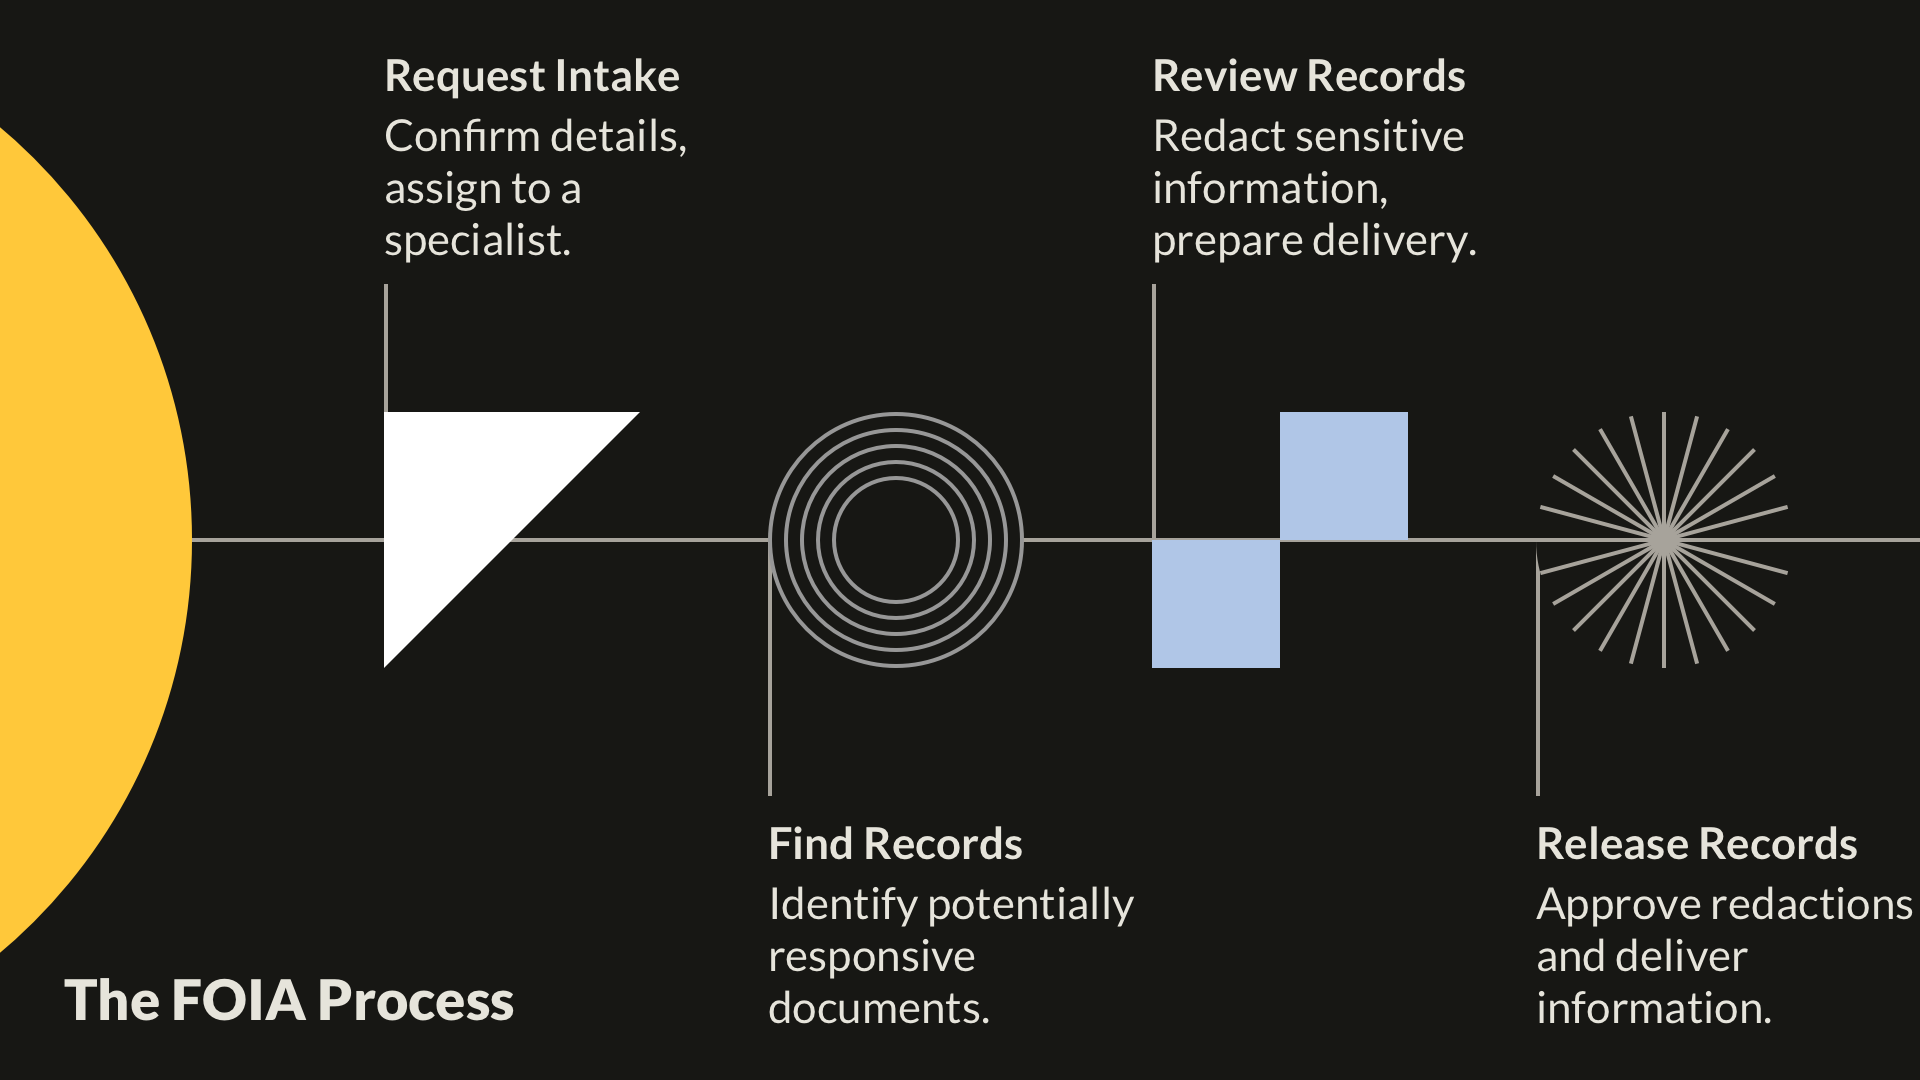
FOIA workflow: Four core steps across multiple systems
The Discovery
A pattern emerged across agencies: the biggest problem wasn't our software — it was finding documents from record custodians.
Here's how FOIA works: when a request comes in, the FOIA officer needs responsive documents from the people who have them. But those people aren't in the FOIA office. They're program staff with other jobs—scientists, lawyers, policy analysts—and they have no deadlines, no accountability, and no incentive to respond quickly. This single step consumed 60-70% of total response time.
Key insight: The bottleneck wasn't technology. It was organizational—FOIA officers had no leverage over record custodians, and agencies had no enforcement mechanism.
I documented this across agencies: response times had grown from 45 days to 81 days over nine years, request volume had doubled since 2020, staff levels stayed flat, and the burden per FOIA officer had increased 88%.
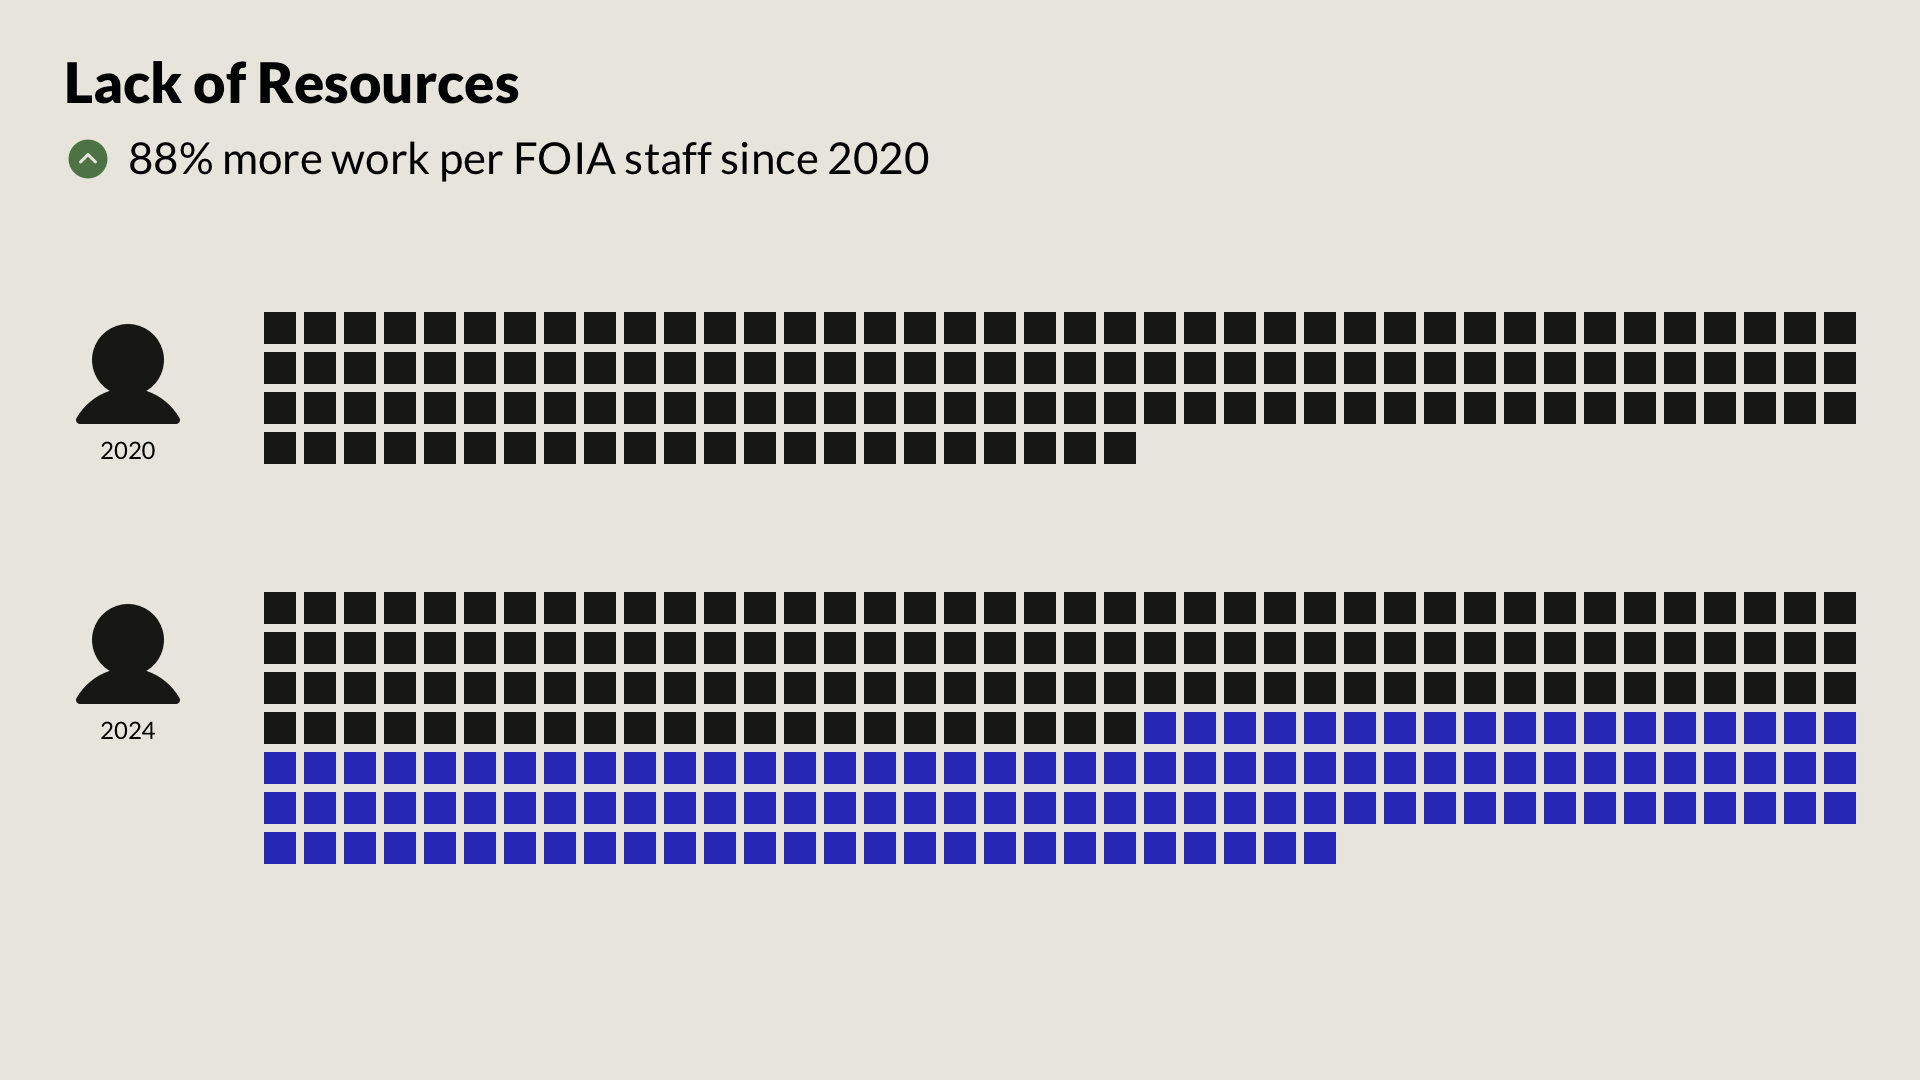
Workload crisis: 88% more requests per FOIA officer with flat staffing levels
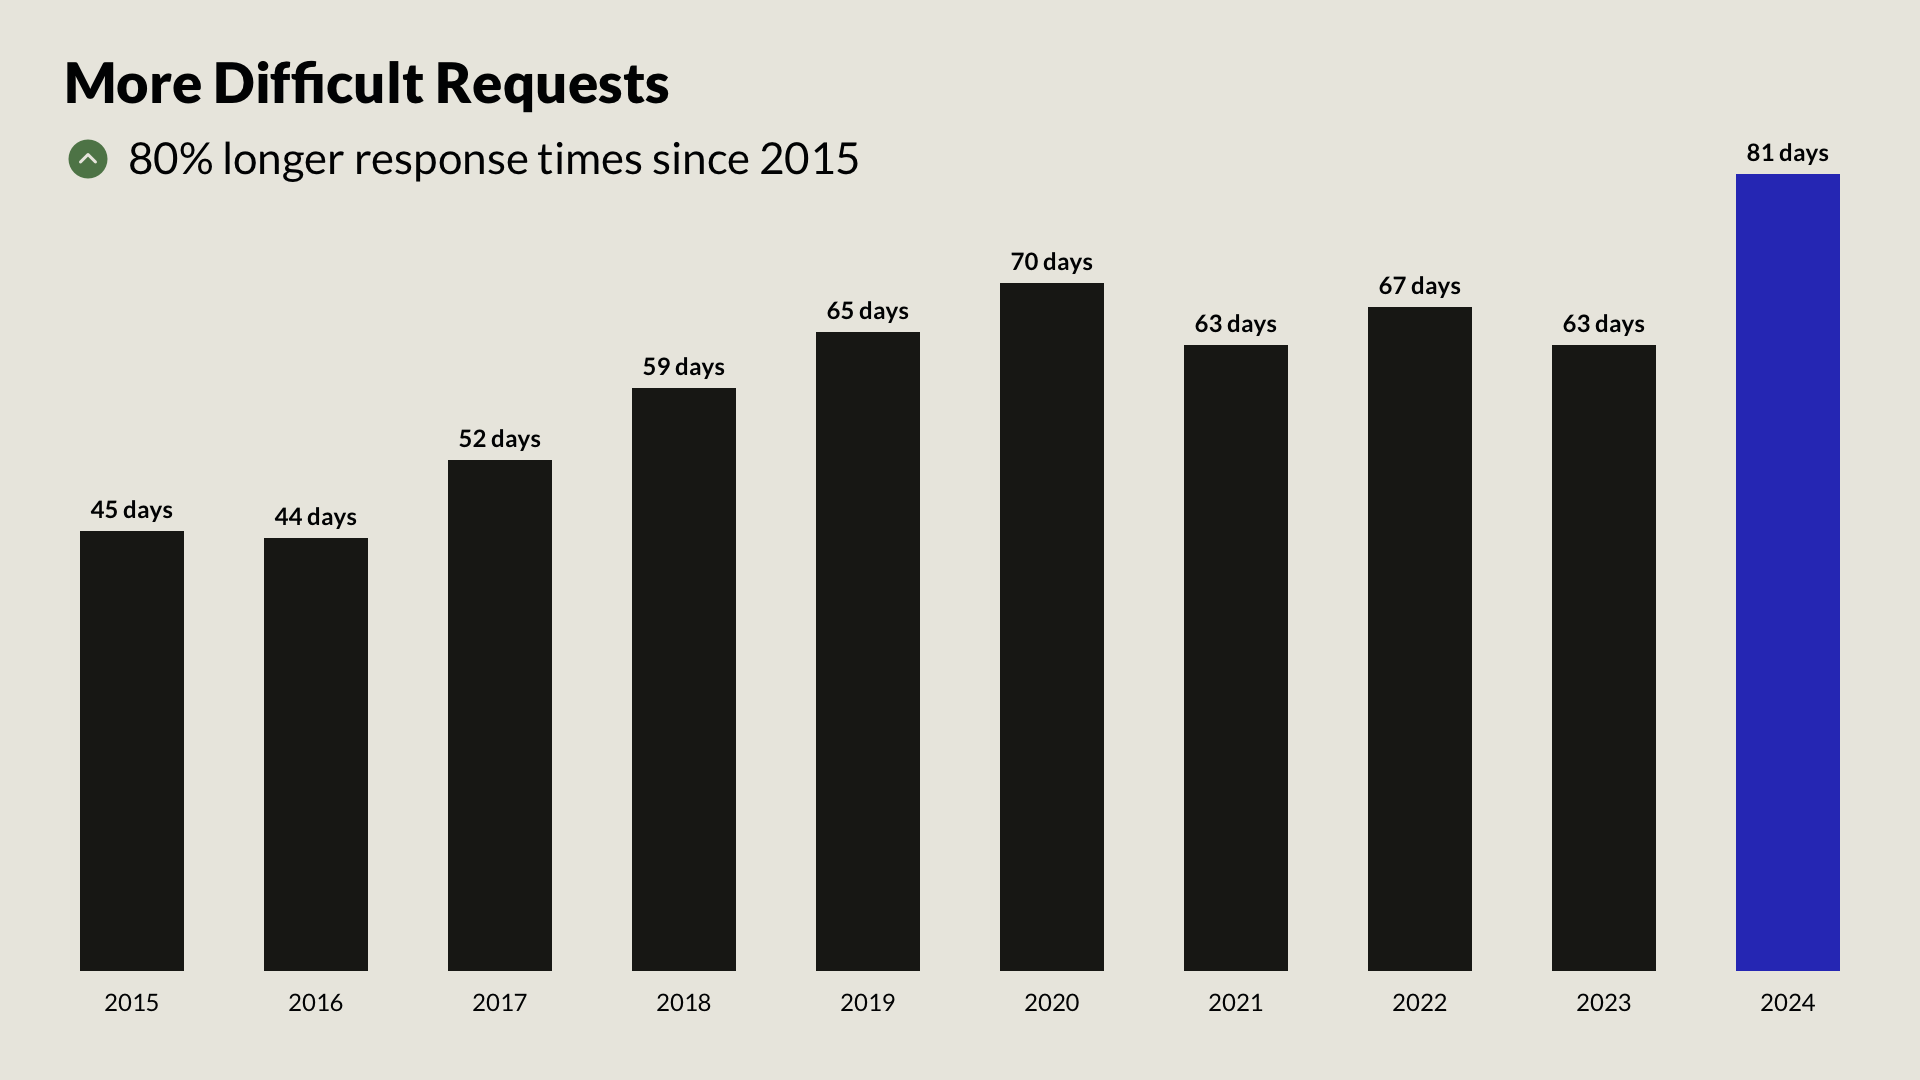
Response time trends: Steady degradation in agency performance over 10 years
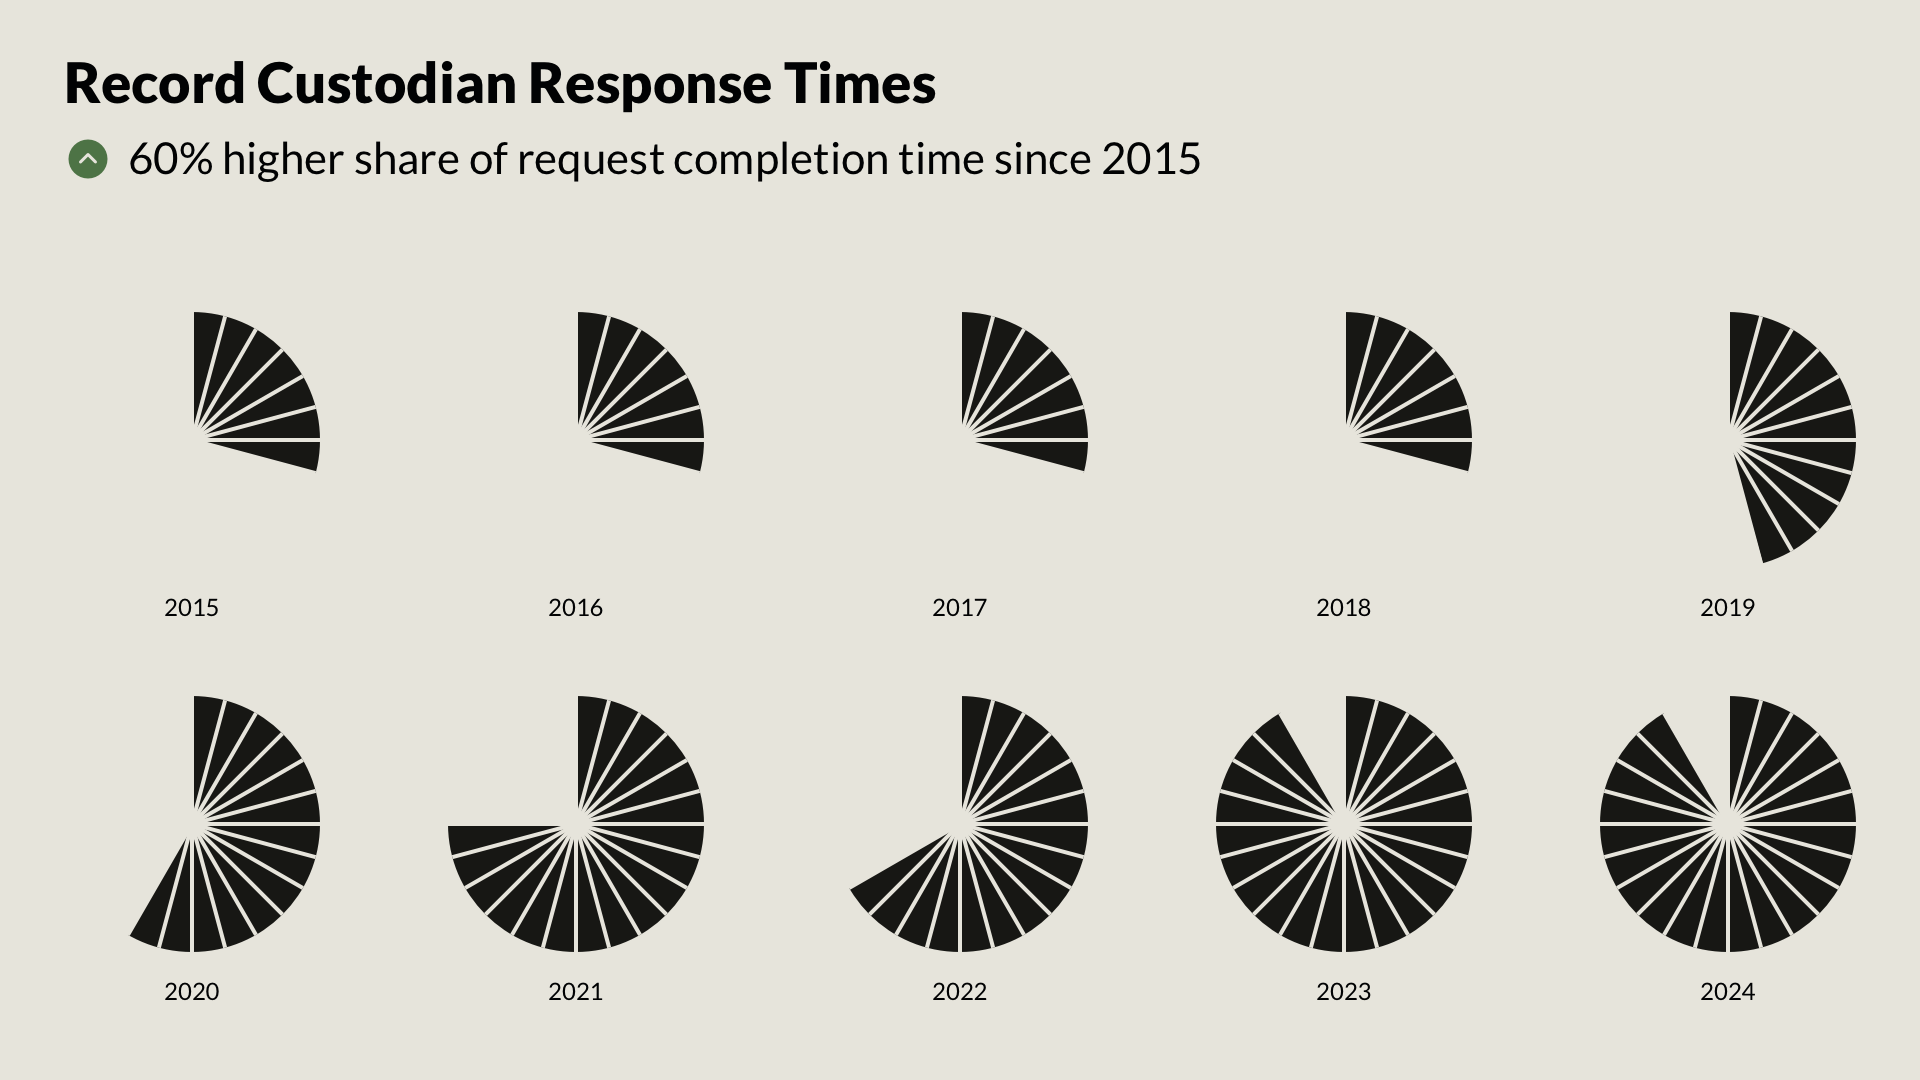
Finding records now occupies 60% more of request completion time in 2024 compared to 2015
Strategic Impact
I presented this research at our company town hall, sales kickoff, customer summits, and to the Executive Leadership Team. The data was clear and the story was compelling — my "State of FOIA" report made it to the Senate floor and influenced federal legislation around record custodian accountability.
This established design as more than a support function; we were shaping industry strategy. And the research was about to influence an even bigger decision.
Making the Business Case with Data, Not Empathy
In January 2025, Thoma Bravo merged OPEXUS with Casepoint, an eDiscovery company. The thesis was based directly on my research: if finding documents was the FOIA bottleneck, integrating Casepoint's eDiscovery tools could streamline workflows and help agencies process more cases. My research had influenced the acquisition strategy.
The question was how to merge two product suites without losing customers. I knew we needed data to make smart decisions, and we didn't have it.
Making the Case for Pendo
I made the case to leadership: we were making million-dollar product decisions based on anecdotes and conference room debates, we couldn't measure feature adoption or identify struggling customers, and we had no early warning system for churn.
They approved the budget. I became the sole Pendo administrator and built the analytics infrastructure from scratch. (For the complete story, see Designing Data-Driven Product Decisions.)
I wrote initialization code for five products across both companies, configured user segmentation by role, agency, and usage patterns, and set up custom events to measure complex workflows — work sophisticated enough that Pendo's product team was surprised when I asked about it at their New York conference.
Every two weeks, the C-suite got a report: three to five key insights, product health metrics, one feature deep dive, customer spotlight, and recommendations with projected impact.
I worked with revenue operations to connect Pendo to Salesforce, creating the first feature-to-revenue attribution system the company had — which features drive renewals, which correlate with expansion, what the expected revenue impact of a new feature might be. We could finally answer these questions.
Biweekly executive report connecting product metrics to business outcomes
Impact on Decision-Making
The report worked because it was visual, actionable, consistent, and credible — executives started asking "What does Pendo say?" in meetings, product decisions required data, and design spoke the language of business.
We started setting KPIs for features before launch, tracked adoption, measured correlation to revenue, and held retrospectives on performance. Design had a voice equal to sales and engineering.
Crisis: When DOGE Threatened $10M in Revenue
In early 2025, reductions in force from the Department of Government Efficiency hit our customers hard — agencies were losing 30-40% of their staff, our per-user pricing model was suddenly at risk, and nobody had data on the scope or business impact.
Analysis Under Pressure
I pulled ten years of Department of Justice FOIA annual reports and wrote Python scripts to analyze the trends, then exported Pendo usage data to CSV and built statistical models to identify at-risk accounts.
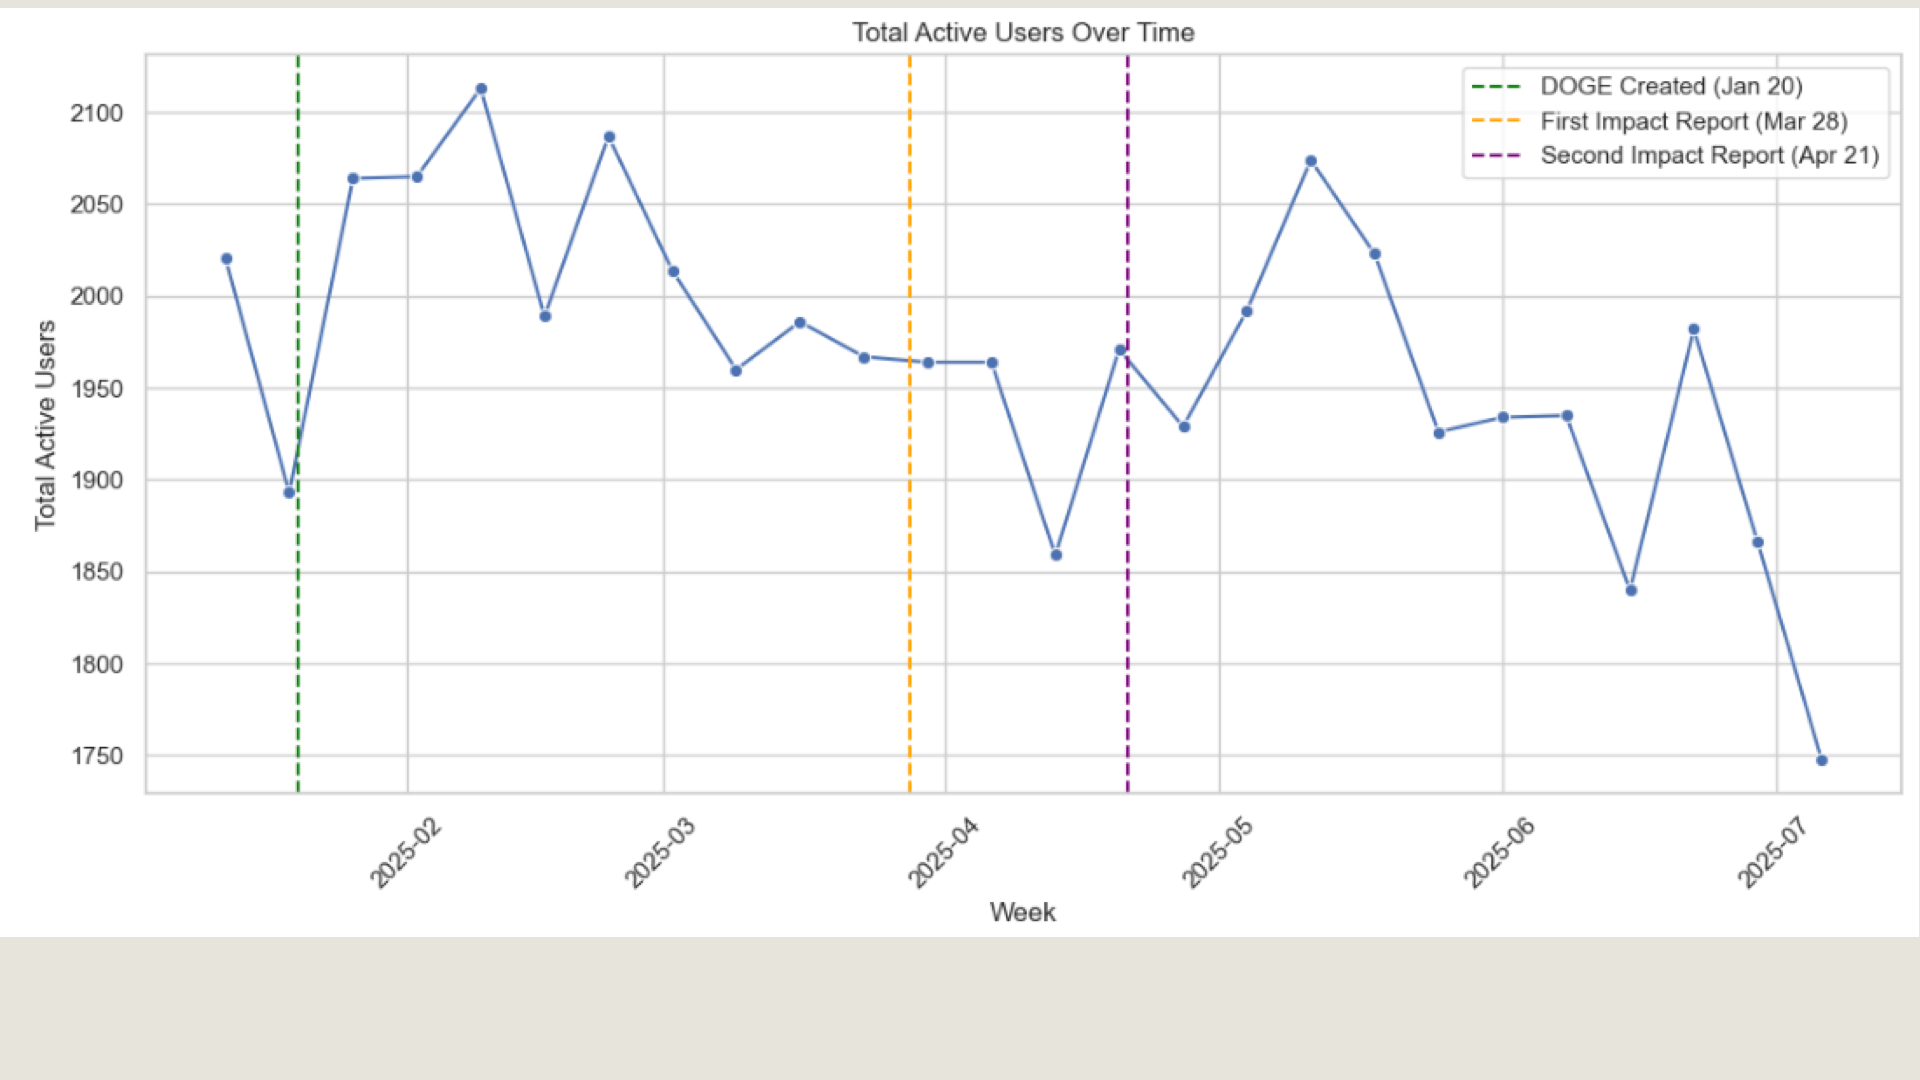
Python analysis identifying $10M+ in at-risk ARR from DOGE policy impacts
I segmented customers by usage trends — growing, steady, volatile, at risk — overlaid DOGE policy events with usage drops, identified millions of dollars in at-risk annual recurring revenue, and created a targeted retention strategy.
Result: This data informed our pricing model revision and enabled proactive account management. We understood the crisis faster than anyone else because we were the only people with the data infrastructure to see it coming. We prevented $10M+ in churn.
Collaborating Across Engineering, Product, and Revenue
None of this work happened in isolation — building a strategic design function meant building relationships and earning trust across the organization.
Key Partnerships
Weekly design system syncs to align on component implementations. I learned React, Vue, and Angular well enough to understand technical constraints and suggest practical solutions. Engineers appreciated that I didn't just throw mockups over the wall.
Joint user research sessions and shared Pendo dashboards — I helped PMs understand user workflows and pain points, they helped me understand business constraints and prioritization tradeoffs, and we became strategic partners rather than order-takers and order-givers.
The Salesforce-Pendo integration required understanding their data model and building reports that mattered to them. I learned to speak their language — ARR, churn risk, expansion signals — and they gave me access to customer data that made my analysis possible.
Our FOIA domain expert became my research partner. She opened doors to agencies, helped me understand FOIA officer workflows, and validated my findings. When I prototyped the Casepoint integration, she was my first reviewer and biggest advocate.
Biweekly Pendo reports to the C-suite, quarterly strategy presentations, and participation in board meetings. I learned to present design decisions in terms of business impact — revenue, efficiency, risk mitigation — not just user experience.
Artifacts from cross-functional collaboration: workshops, research synthesis, strategy sessions
Results: From Solo Designer to Board-Level Function
Starting from zero, I built a complete design function in three years: a design system covering ten products and eight thousand users that increased development efficiency by 40%, a product analytics function across five products with board-level reporting, a research practice engaging more than seventy agencies with regular customer conversations, the company's first feature-to-revenue attribution system, a distributed design organization managing offshore designers, and new products like the Public FOIA Portal that reduced request volume 32%.
The work influenced federal legislation when my research was presented to the Senate, informed Thoma Bravo's acquisition thesis, prevented $10M in customer churn, and established design as a board-level strategic function.
The biggest change was cultural: design went from nonexistent to strategic, product decisions went from gut-based to data-driven, and customer research went from never to regular practice.
Key Lessons
Infrastructure Matters More Than Features
The design system, Pendo analytics, and research practice created more lasting value than any individual design. Strategic work compounds over time — a single well-instrumented dashboard informs hundreds of decisions, a single well-documented component eliminates thousands of hours of re-implementation.
Data Earns Credibility
User empathy matters, but executives need numbers. The biweekly Pendo report gave design a voice in strategic conversations because it spoke the language of business — revenue, retention, efficiency, growth.
Deep Customer Understanding Creates Opportunities Beyond Design
The FOIA bottleneck discovery improved our product but also influenced an acquisition and federal legislation. Research drives strategy when you pay attention to patterns and communicate findings to the right stakeholders.
Speed Is a Competitive Advantage
The one-week integration prototype, the rapid Pendo implementation, the Python analyses during the DOGE crisis — moving fast while maintaining quality builds trust and influence, but you need to build the infrastructure that makes that speed possible.
What I'd Do Differently
I would have brought on a second designer earlier. By the time we merged with Casepoint, I was stretched thin managing offshore designers while still doing IC work, and scaling the team six months earlier would have let us ship more redesigns and conduct more research.
I also would have documented design decisions better. We moved fast and shipped a lot, but we didn't always write down why we made certain choices, and when new engineers joined they sometimes undid intentional decisions because the rationale wasn't captured.